

Solar PV Monitoring: What to Track So Your Plant Produces What It Should
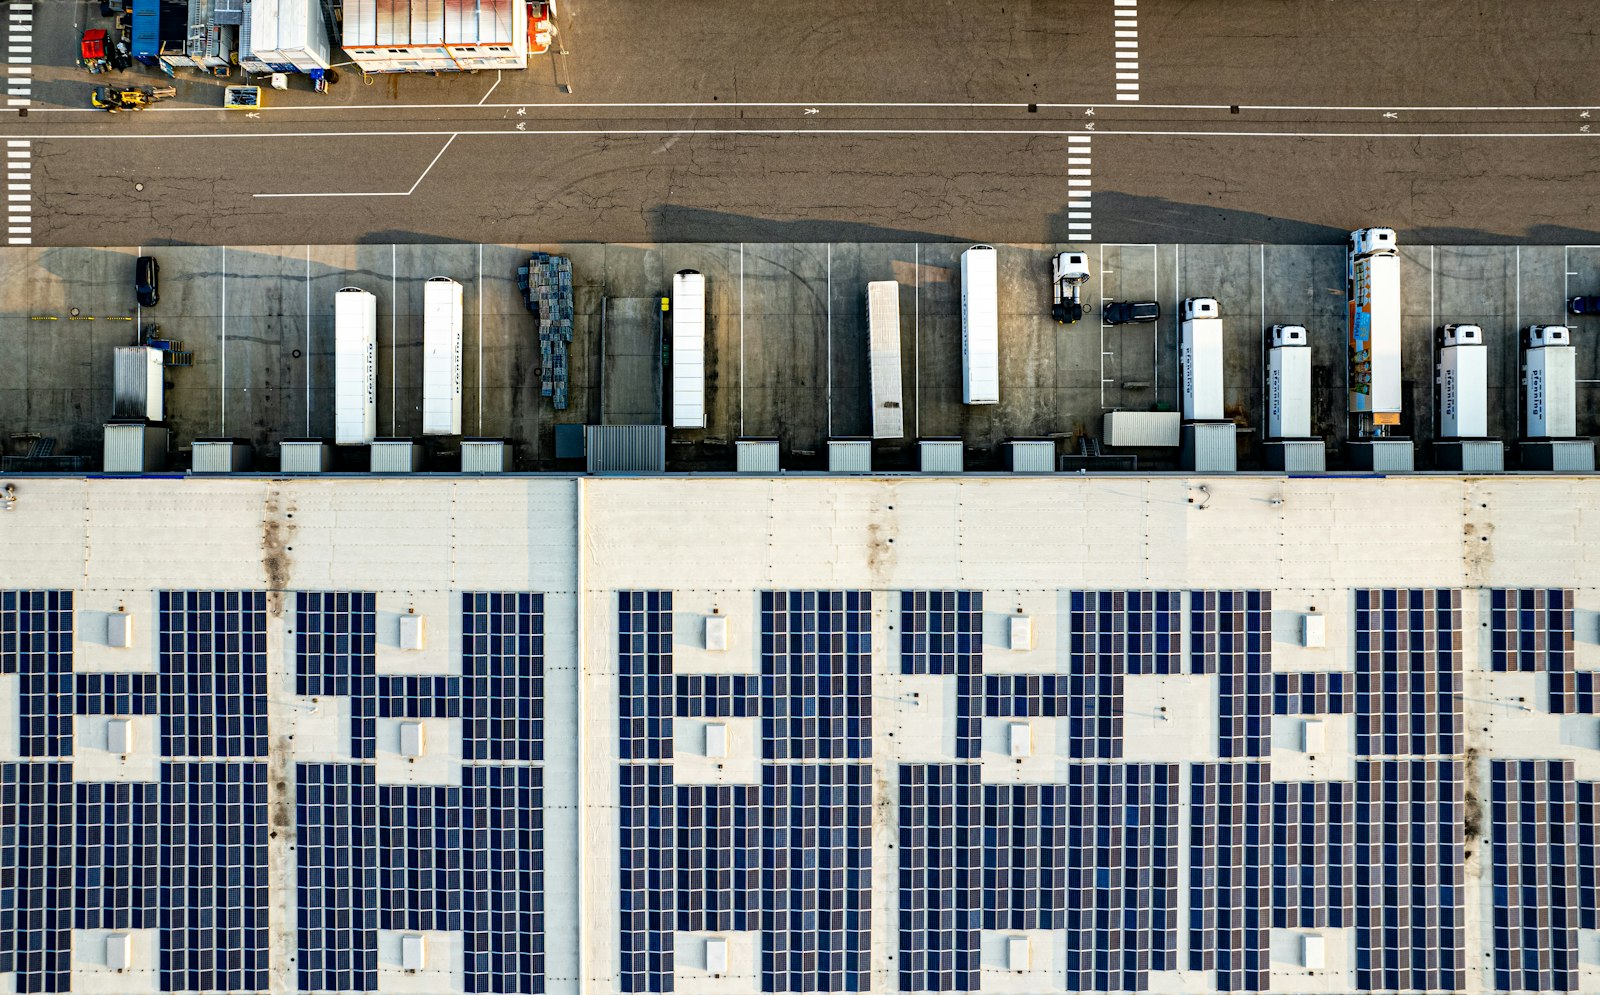
A rooftop solar plant works quietly for years. That is exactly why nobody notices when it has been producing less than it should for some time.
A faulty inverter, shading from a new rooftop structure, heavy soiling or a disconnected string never show up in daily operations. The lights stay on, the computers keep running, and the shortfall only appears on the energy statement. By then the plant may have underperformed for weeks or months.
Monitoring turns this around: it tells you that production is drifting from what is expected, before a small deviation becomes a long-term loss. It is not about piling up charts, but about a few well-chosen readings. It builds on our article on what to monitor in a building before users notice a problem. Solar PV is simply one more data source that belongs in the same overview.
Why “kWh produced” is not enough
Most inverters show total energy produced. That figure does not say whether it is a lot or a little. In a cloudy week, even a perfectly healthy plant produces little, while on a sunny day a “decent-looking” number may in fact be a fifth below what the plant can deliver.
That is why production is compared with expectation. Engineering literature uses, for example, the performance ratio (PR): actual output relative to what the plant should deliver under the measured irradiance. The point is not one number but the trend. Is it falling gradually (soiling, ageing) or suddenly (a fault, a disconnection)? The expected value depends on technology, orientation and location, so always judge it against your own plant rather than a generic table.
What to track on a solar plant
| Reading | What it reveals | Typical problem it catches |
|---|---|---|
| Production over time | Daily and seasonal profile compared with expectation | Output persistently below the same period last year |
| Irradiance and weather | Whether low output is due to weather or the plant | Telling "overcast" from a real fault |
| Output per inverter and string | Parts of the plant compared with each other | One string or inverter lagging behind the rest |
| Inverter fault messages | Trips, overheating, grid issues | An inverter that keeps shutting down and restarting |
| Soiling and shading | Gradual or sudden loss of output | Dust, leaves, bird droppings or a new shading object |
| Self-consumption and export | How much of the energy the building uses itself | Consumption outside production hours; needless export to the grid |
| Battery (if installed) | Charging, discharging and state | A battery that does not charge or discharges at the wrong time |
Rule of thumb: Comparison is what counts. Inverter against inverter, string against string, today against expectation in the same weather. A single value says nothing on its own.
Typical causes of lower output
The inverter and its faults
Research on PV plants suggests a large share of faults occur in the inverter and do not always appear as a clear outage. More often it is a variable loss: the inverter trips repeatedly, tracks the maximum power point poorly or runs restricted for part of the day. Such a deviation is easily lost in the total, yet it stands out when inverters are compared and fault messages are tracked.
Soiling and shading
Soiling usually shows up as a slow decline in output that recovers after heavy rain or cleaning. Shading, such as a new antenna, chimney or growing tree, often appears only at certain times of day and only on part of the array. Typical loss figures vary widely with location and surroundings, so follow your own trend rather than relying on generic numbers.
Gradual ageing and damage
Panels lose a little output over the years, which is normal. What is suspicious is one string falling faster than the others, or localised hot spots. A thermal camera helps during a service visit, and monitoring tells you where and when it is worth using one.
Communication and data
Sometimes the plant is producing fine but has simply stopped sending data. Good monitoring therefore checks that data keeps arriving. Silence from an inverter is information too.
Solar PV in the context of the whole building
Production is only half the picture. What the building consumes at the same moment matters just as much. A plant on the roof of an office, a shop unit or a warehouse pays off most when the energy is used on site. When production, consumption and any battery are shown together, you may see that air conditioning starts as the sun goes down, or that export to the grid happens every weekend when the premises are closed.
We will cover this in separate articles on self-consumption and on managing solar, battery and building load together. The foundation is always a reliable view of what the plant is actually doing.
Examples from different property types
Warehouse. A large roof, little shading and heavy cooling or equipment-charging loads. Comparing several inverters and spotting a disconnected string early are what matter.
Shop unit. Daytime consumption during opening hours matches production well. Monitoring shows whether midday output is really used or exported.
Office. Consumption follows occupancy and the season. An overview helps separate a drop in production from a change in how the building is used.
Premises with several roofs. Different orientations and shading mean different expectations. Each section is judged against its own profile.
Setting up alerts that make sense
- Collect data first. A few weeks of operation show what a normal day looks like for your plant.
- Alert on deviations, not every fluctuation. A cloud at noon is not a fault. Several days of below-par output in good weather is.
- Separate severity levels. An inverter fault is urgent; gradual soiling is planned maintenance.
- Name who handles each alert. Every alert needs a recipient and a next step.
- Watch for data gaps too. Missing readings are a reason to check.
Checklist: what to have covered on a solar plant
- Production over time – daily and seasonal profile against expectation.
- Inverter and string comparison – no part of the plant lags unnoticed.
- Inverter fault messages – repeated trips and grid faults.
- Irradiance or weather data – you can tell weather from a fault.
- Output decline trend – gradual soiling and degradation.
- Self-consumption and export – you know how much of the energy the building uses.
- Battery state – if you have one.
- Data arrival – an alert when data stops coming in.
- Responsible person – knows what to do when an alert arrives.
FAQ
Is the manufacturer’s inverter app enough?
For a basic view, often yes. The limitation is that it only shows the plant itself, and each brand has its own environment. If you want production alongside consumption and other building systems, a shared overview is useful.
How can I tell low output is down to weather?
By comparing it with irradiance or with the expected output for that weather. Without that, a cloudy week is easily mistaken for a fault.
How often should panels be cleaned?
It depends on location, tilt and surroundings, such as nearby fields, roads or trees. The decision should rest on the output trend, not a fixed calendar.
Can monitoring be added to an existing plant?
Often yes. Many inverters can provide data and be connected to a shared overview without touching the panels. The specifics depend on the equipment.
Does monitoring promise higher returns?
No. It helps the plant produce what it is capable of and ensures a drop in output does not go unnoticed.
From sensor to real action
PV readings are most valuable when they turn into a concrete step. Data from the plant is therefore collected in one place alongside the building’s other measurements and presented in the INTECHI client zone. The alert goes to whoever should handle it, and in one step it becomes a service request in INTECHI Digital Management. Equipment is registered, so the technician knows what they are coming to. The solution can grow gradually: start with the plant and later add consumption, a battery or further sites. More about the technology is on the Smart technologies page at intechi.cz.
How INTECHI approaches it
INTECHI TECHNOLOGY knows solar plants and connects them to building monitoring: production, self-consumption, battery and alerts in one place, in one client zone. We use the same technology as INTECHI at intechi.cz. If you want certainty that your plant is producing as it should, get in touch.
+420 735 861 612 | [email protected] | intechi.tech